Late Winter Cold Snap

climate
R
temperature
Published

February 7, 2024

Introduction

Path to the rental

Last week my friend Ned wrote an interesting article about the latest cold snap for the local newspaper. In the article he mentions that I said that the current cold snap is the second coldest since we moved down to Goldstream Creek more than 15 years ago. Turns out that the ranking depends on how you measure the “coldness” of a cold snap, and since the article was written, we had a second cold snap colder than the one he was writing about.

The National Weather Service posted this Public Information Statement today:

The cold snap of January and February 2024 lasted for 15 days from January 21 until it ended on February 4. Fairbanks had 13 days in a row that remained 14 below zero or colder. This was the 23rd longest streak of days with 14 below or colder in the past 120 years, making this type of cold snap one that occurs about once every 5 years.

This cold snap had 10 days that dropped to 40 below zero or colder, which compares with a 30 year normal of 7 days per winter with 40 below or colder. The past 10 years have only averaged 3 days per winter with 40 below or colder. The last time there were this many 40 below readings was the winter of 2012/2013 when there were 15 days of 40 below or colder.

This cold snap had one day reaching 50 below zero, which had not occurred in Fairbanks since 2017.

Minus 14 seems like a strange way to define a “cold snap”, but I like how it puts the cold snap into a historical (one out of every five years), 30-year (10 days below -40 compared to a normal of 7), and 10-year perspective (10 days below -40 vs a normal 3).

Let’s take a closer look.

Goldstream Creek

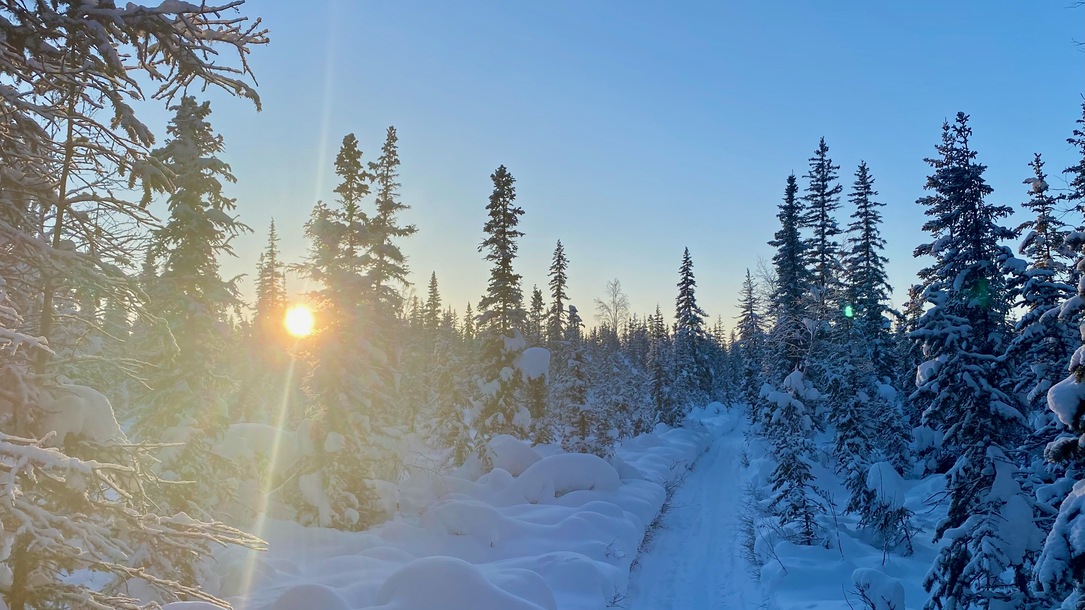
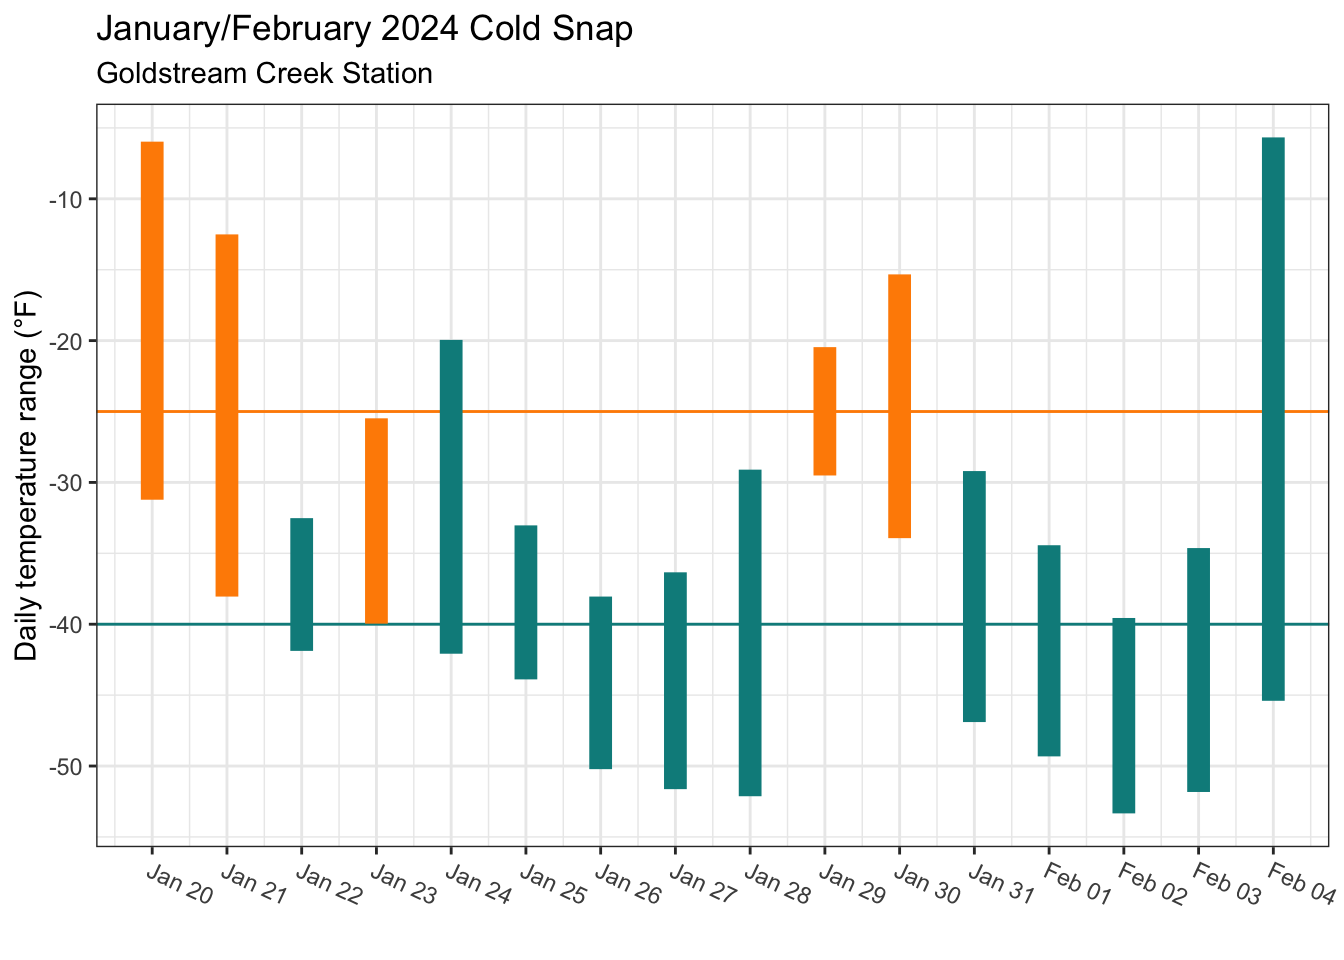
Here’s a view of the cold snap from our weather station on Goldstream Creek. The plot shows the daily minimum and maximum temperatures. The color of the vertical bars identify whether they qualify as part of a -25 cold snap or a -40 cold snap.

Code
library(tidyverse)

ggplot() +
  geom_hline(
    aes(yintercept = -25), color = "darkorange"
  ) +
  geom_hline(
    aes(yintercept = -40), color = "darkcyan"
  ) +
  geom_linerange(
    data = cold |>
      filter(dte > "2024-01-19") |>
      mutate(snap = min_west_temp <= -40),
    aes(
      x = dte, ymin = min_west_temp, 
      ymax = max_west_temp, color = snap
    ),
    linewidth = 4
  ) +
  scale_x_date(
    name = "",
    date_breaks = "1 day",
    date_labels = "%b %d"
  ) +
  scale_y_continuous(name = "Daily temperature range (°F)") +
  scale_color_manual(values = c("darkorange", "darkcyan")) +
  guides(color = "none") +
  theme_bw() +
  theme(
    axis.text.x = element_text(
      angle = 335, hjust = 0, vjust = 1
    )
  ) +
  labs(
    title = "January/February 2024 Cold Snap",
    subtitle = "Goldstream Creek Station"
  )

We initially dipped below -40 on January 22nd, but the first -40 cold snap didn’t really start until January 24th and it lasted five days. There was a brief “warm” spell of two days, then the second cold spell ran from January 31st until February 4th, where it warmed up -5.7 °F.

If we use -25 °F as the cutoff, the cold snap lasted sixteen days from January 20th through February 4th.

To compare these cold snaps against the “historical” record for Goldstream Creek, which goes back to 2009, we’ll calculate the difference between the cold snap cutoff and the actual minimum temperature on each day, then sum those differences. For example, if we are using a cutoff of -40 and the daily minimum temperatures were -45 °F and -50 °F, the total would be 15 degrees.

Using a -40 degree cutoff, here’s how the two cold snaps rank among the coldest weather we’ve experienced on the creek.

Code
library(gt)

cutoff <- -40

cold |>
  filter(min_west_temp <= cutoff) |>
  arrange(dte) |>
  mutate(
    rle = as.integer(
      dte - lag(dte, 1, default = ymd("2000-01-01")) != 1
    ),
    rle = cumsum(rle)
  ) |>
  group_by(rle) |>
  summarize(
    start_date = min(dte),
    end_date = max(dte),
    days = n(),
    min_temp = min(min_west_temp),
    temps = paste(min_west_temp, collapse = ","),
    sum_below_cutoff = sum(cutoff - min_west_temp)
  ) |>
  arrange(desc(sum_below_cutoff)) |>
  mutate(rank = rank(desc(sum_below_cutoff))) |>
  select(
    rank, start_date, end_date, days,
    min_temp, sum_below_cutoff
  ) |>
  head(n = 10) |>
  gt() |>
  cols_label(
    rank = "Rank",
    start_date = "Start",
    end_date = "End",
    days = "Days",
    min_temp = html("Minimum Temperature<br>(°F)"),
    sum_below_cutoff = html("Sum below cutoff<br>(°F)")
  )
Rank Start End Days Minimum Temperature
(°F)
Sum below cutoff
(°F)
1 2024-01-31 2024-02-04 5 -53.34 46.79
2 2024-01-24 2024-01-28 5 -52.13 39.95
3 2012-01-27 2012-01-30 4 -53.33 39.90
4 2012-12-15 2012-12-22 8 -45.33 27.79
5 2017-01-17 2017-01-19 3 -51.30 27.55
6 2013-01-25 2013-01-28 4 -47.64 19.78
7 2012-01-13 2012-01-17 5 -46.51 19.54
8 2019-01-11 2019-01-12 2 -44.27 8.31
9 2022-01-02 2022-01-05 4 -43.93 7.34
10 2022-12-19 2022-12-21 3 -43.70 7.14

The second cold snap from this winter was quite a bit colder than the first, but both beat out any of the other cold snaps, including an 8 day cold snap in 2012. The second cold snap included two days colder than -50 °F, and registered the record minimum temperature at the station of -50.34 °F.

Here’s the same analysis using a -25 °F cutoff.

Code
cutoff <- -25

cold |>
  filter(min_west_temp <= cutoff) |>
  arrange(dte) |>
  mutate(
    rle = as.integer(
      dte - lag(dte, 1, default = ymd("2000-01-01")) != 1
    ),
    rle = cumsum(rle)
  ) |>
  group_by(rle) |>
  summarize(
    start_date = min(dte),
    end_date = max(dte),
    days = n(),
    min_temp = min(min_west_temp),
    temps = paste(min_west_temp, collapse = ","),
    sum_below_cutoff = sum(cutoff - min_west_temp)
  ) |>
  arrange(desc(sum_below_cutoff)) |>
  mutate(rank = rank(desc(sum_below_cutoff))) |>
  select(
    rank, start_date, end_date, days,
    min_temp, sum_below_cutoff
  ) |>
  head(n = 10) |>
  gt() |>
  cols_label(
    rank = "Rank",
    start_date = "Start",
    end_date = "End",
    days = "Days",
    min_temp = html("Minimum Temperature<br>(°F)"),
    sum_below_cutoff = html("Sum below cutoff<br>(°F)")
  )
Rank Start End Days Minimum Temperature
(°F)
Sum below cutoff
(°F)
1 2024-01-20 2024-02-04 16 -53.34 301.29
2 2012-12-14 2012-12-24 11 -45.33 174.00
3 2011-12-27 2012-01-10 15 -40.65 146.76
4 2022-01-01 2022-01-09 9 -43.93 133.91
5 2012-01-25 2012-02-01 8 -53.33 133.35
6 2012-01-13 2012-01-21 9 -46.51 130.23
7 2020-01-03 2020-01-12 10 -42.23 119.23
8 2022-12-16 2022-12-25 10 -43.70 110.50
9 2011-01-15 2011-01-23 9 -42.21 108.14
10 2010-12-14 2010-12-24 11 -39.62 96.52

It still comes out on top, by a large margin, because of how long it was, and how much colder it was than the cutoff.

Fairbanks Airport

Our station is one of the colder stations in the Fairbanks area, but we only have data for the past 15 years. If we want to put this cold snap into historical context, we’ll need to use data from the airport station.

Using -40 degrees as the cutoff, the recent cold weather barely registers. Here’s the top 10 (and the recent cold snaps):

Code
manual_pafa_cold <- tribble(
  ~dte, ~min_temp_f, ~max_temp_f,
  "2024-02-02", -50, -38,
  "2024-02-03", -49, -33,
  "2024-02-04", -43, -3
) |>
  filter(min_temp_f <= -25) |>
  mutate(dte = ymd(dte))

pafa_cold <- bind_rows(pafa_cold, manual_pafa_cold) |>
  arrange(dte)

cutoff <- -40

pafa_cold |>
  filter(min_temp_f <= cutoff) |>
  arrange(dte) |>
  mutate(
    rle = as.integer(
      dte - lag(dte, 1, default = ymd("2000-01-01")) != 1
    ),
    rle = cumsum(rle)
  ) |>
  group_by(rle) |>
  summarize(
    start_date = min(dte),
    end_date = max(dte),
    days = n(),
    min_temp = min(min_temp_f),
    temps = paste(min_temp_f, collapse = ","),
    sum_below_cutoff = sum(cutoff - min_temp_f)
  ) |>
  select(-rle) |>
  arrange(desc(sum_below_cutoff)) |>
  mutate(rank = rank(
    desc(sum_below_cutoff),
    ties.method = "first")
  ) |>
  select(
    rank, start_date, end_date, days,
    min_temp, sum_below_cutoff
  ) |>
  filter(rank <= 10 | (start_date > "2023-12-01" & days > 3)) |>
  gt() |>
  cols_label(
    rank = "Rank",
    start_date = "Start",
    end_date = "End",
    days = "Days",
    min_temp = html("Minimum Temperature<br>(°F)"),
    sum_below_cutoff = html("Sum below cutoff<br>(°F)")
  )
Rank Start End Days Minimum Temperature
(°F)
Sum below cutoff
(°F)
1 1971-01-14 1971-01-31 18 -60 222
2 1947-01-23 1947-02-05 14 -59 200
3 1961-12-16 1961-12-30 15 -62 179
4 1964-12-25 1965-01-11 18 -56 161
5 1935-12-02 1935-12-13 12 -59 155
6 1934-01-18 1934-01-26 9 -60 146
7 1951-01-14 1951-01-25 12 -54 135
8 1968-12-28 1969-01-06 10 -61 129
9 1934-01-10 1934-01-16 7 -66 125
10 1946-12-06 1946-12-16 11 -57 120
50 2024-01-31 2024-02-04 5 -50 33
151 2024-01-25 2024-01-28 4 -43 7

Not even close. The coldest cold snap in 1971 lasted 18 days and reached a minimum of -60 °F twice and temperatures below -50 °F on 13 of those 18 days. We just don’t get weather like that anymore. Those were the last -60 °F temperatures recorded at the airport, and even -50 °F is becoming rare. Here’s the average number of days with temperatures -50 °F or colder by decade:

Code
pafa_cold |>
  filter(min_temp_f <= -50) |>
  mutate(year = year(dte)) |>
  count(year) |>
  mutate(decade = floor(year / 10) * 10) |>
  group_by(decade) |>
  summarize(days_below_minus_50 = mean(n)) |>
  arrange(desc(days_below_minus_50)) |>
  gt() |>
  cols_label(
    decade = "Decade",
    days_below_minus_50 = html("Average number of days<br>-50 °F or colder")
  ) |>
  fmt_number(decimals = 1, columns = "days_below_minus_50") |>
  cols_align("left", columns = "decade")
Decade Average number of days
-50 °F or colder
1940 7.0
1930 6.1
1960 5.9
1970 5.6
1950 5.6
1990 4.0
1920 2.0
2010 1.5
1980 1.3
2000 1.0
2020 1.0

As Ned said, Alaska is still good at making cold, but nowhere near as good as it used to be!